Debugging the Tradecraft Garden
The suggested way to get started with Crystal Palace and the Tradecraft Garden projects is through the Windows Subsystem for Linux (WSL) on Windows. If you don't know what WSL is (where have you been!?) the tl;dr is that it's a compatibility layer for running a Linux environment directly on top of Windows, without the need for a VM or to dual-boot.
If you're familiar with Raffi's work, then you'll know that his preference is generally to write everything on Linux, usually just in nano, and cross-compile for Windows. The TCG setup guide therefore has you install the mingw-w64 cross-compiler and make for building TCG projects; and the Java openjdk for running Crystal Palace; all inside an Ubuntu WSL instance.
As a bare-minimum dev environment, this undoubtedly works really well. However, there are two aspects of development that I find really difficult to adapt to, and that's 1) not having any intellisense; and 2) not having a managed debugger. My goal for this post was to see if I could improve my QoL when working with the TCG, but in a way that respects the original setup guidance.
Visual Studio Code
I find Visual Studio Code to be a nice middle-ground between a text-based editor like nano, and a full-fat IDE like Visual Studio, CLion, Rider, etc. However, if you launch vscode in Windows and open a TCG project, you'll likely be greeted with a litany of errors.
This is because the TCG is specifically written for MinGW, and we don't have that installed in Windows (at least I don't). My vscode tries to use cl.exe instead, which is Microsoft's MSVC compiler & linker, and this doesn't support things like __attribute__ or __typeof__, hence all the errors.
Here is where I discovered the magic of the WSL vscode extension. One of its key features for us is in allowing access to compilers in the WSL environment, without needing modify the Windows environment. That means we can have vscode use the mingw compiler that is already installed in WSL as per the TCG setup. Once the extension is installed, you can activate 'remote mode' either by running vscode directly from a WSL command prompt:
daniel@RastaPad:/mnt/c/Tools/tcg/simple_rdll$ code .Or by running it from Windows first, clicking on the blue icon in the bottom-left, and then selecting the WSL instance you want to connect to.
Once connected, you'll see all the project files, hopefully no code errors, full intellisense, and a WSL terminal as though the instance of vscode was running inside Linux.
Beautiful.
I wasn't able to get debugging working directly inside vscode with this setup. I think this is some limitation with GDB trying to debug a Windows PE on Linux. You may be able to debug via Wine or something, but ugh. If this isn't the case and you know how to make it work, do let me know.
Debug Builds
The next best solution that I could think of was to produce a debuggable executable that I could use with WinDbg (other debuggers are available). The way I did this was to add a new 'debug' build to the Makefile. Adding the -g option embeds the required debug information; and then we can link it to an executable build, specifying 'go' as the entry point.
CC_64=x86_64-w64-mingw32-gcc

all: bin/loader.x86.o bin/loader.x64.o
debug: bin/loader.x64.exe

bin:
	mkdir bin

...

bin/loader.x64.exe: bin
	$(CC_64) -DWIN_X64 -shared -g -masm=intel -Wall -Wno-pointer-arith -c src/loader.c -o bin/loader.x64.o
	$(CC_64) -DWIN_X64 -nostartfiles -g -Wl,-e,go bin/loader.x64.o -o bin/loader.x64.exe
Makefile
$ make clean; make debug
rm -f bin/*
x86_64-w64-mingw32-gcc -DWIN_X64 -shared -g -masm=intel -Wall -Wno-pointer-arith -c src/loader.c -o bin/loader.x64.o
x86_64-w64-mingw32-gcc -DWIN_X64 -nostartfiles -g -Wl,-e,go bin/loader.x64.o -o bin/loader.x64.exe
$ ls -l bin/
total 44
-rwxrwxrwx 1 daniel daniel 24400 Jul 24 22:03 loader.x64.exe
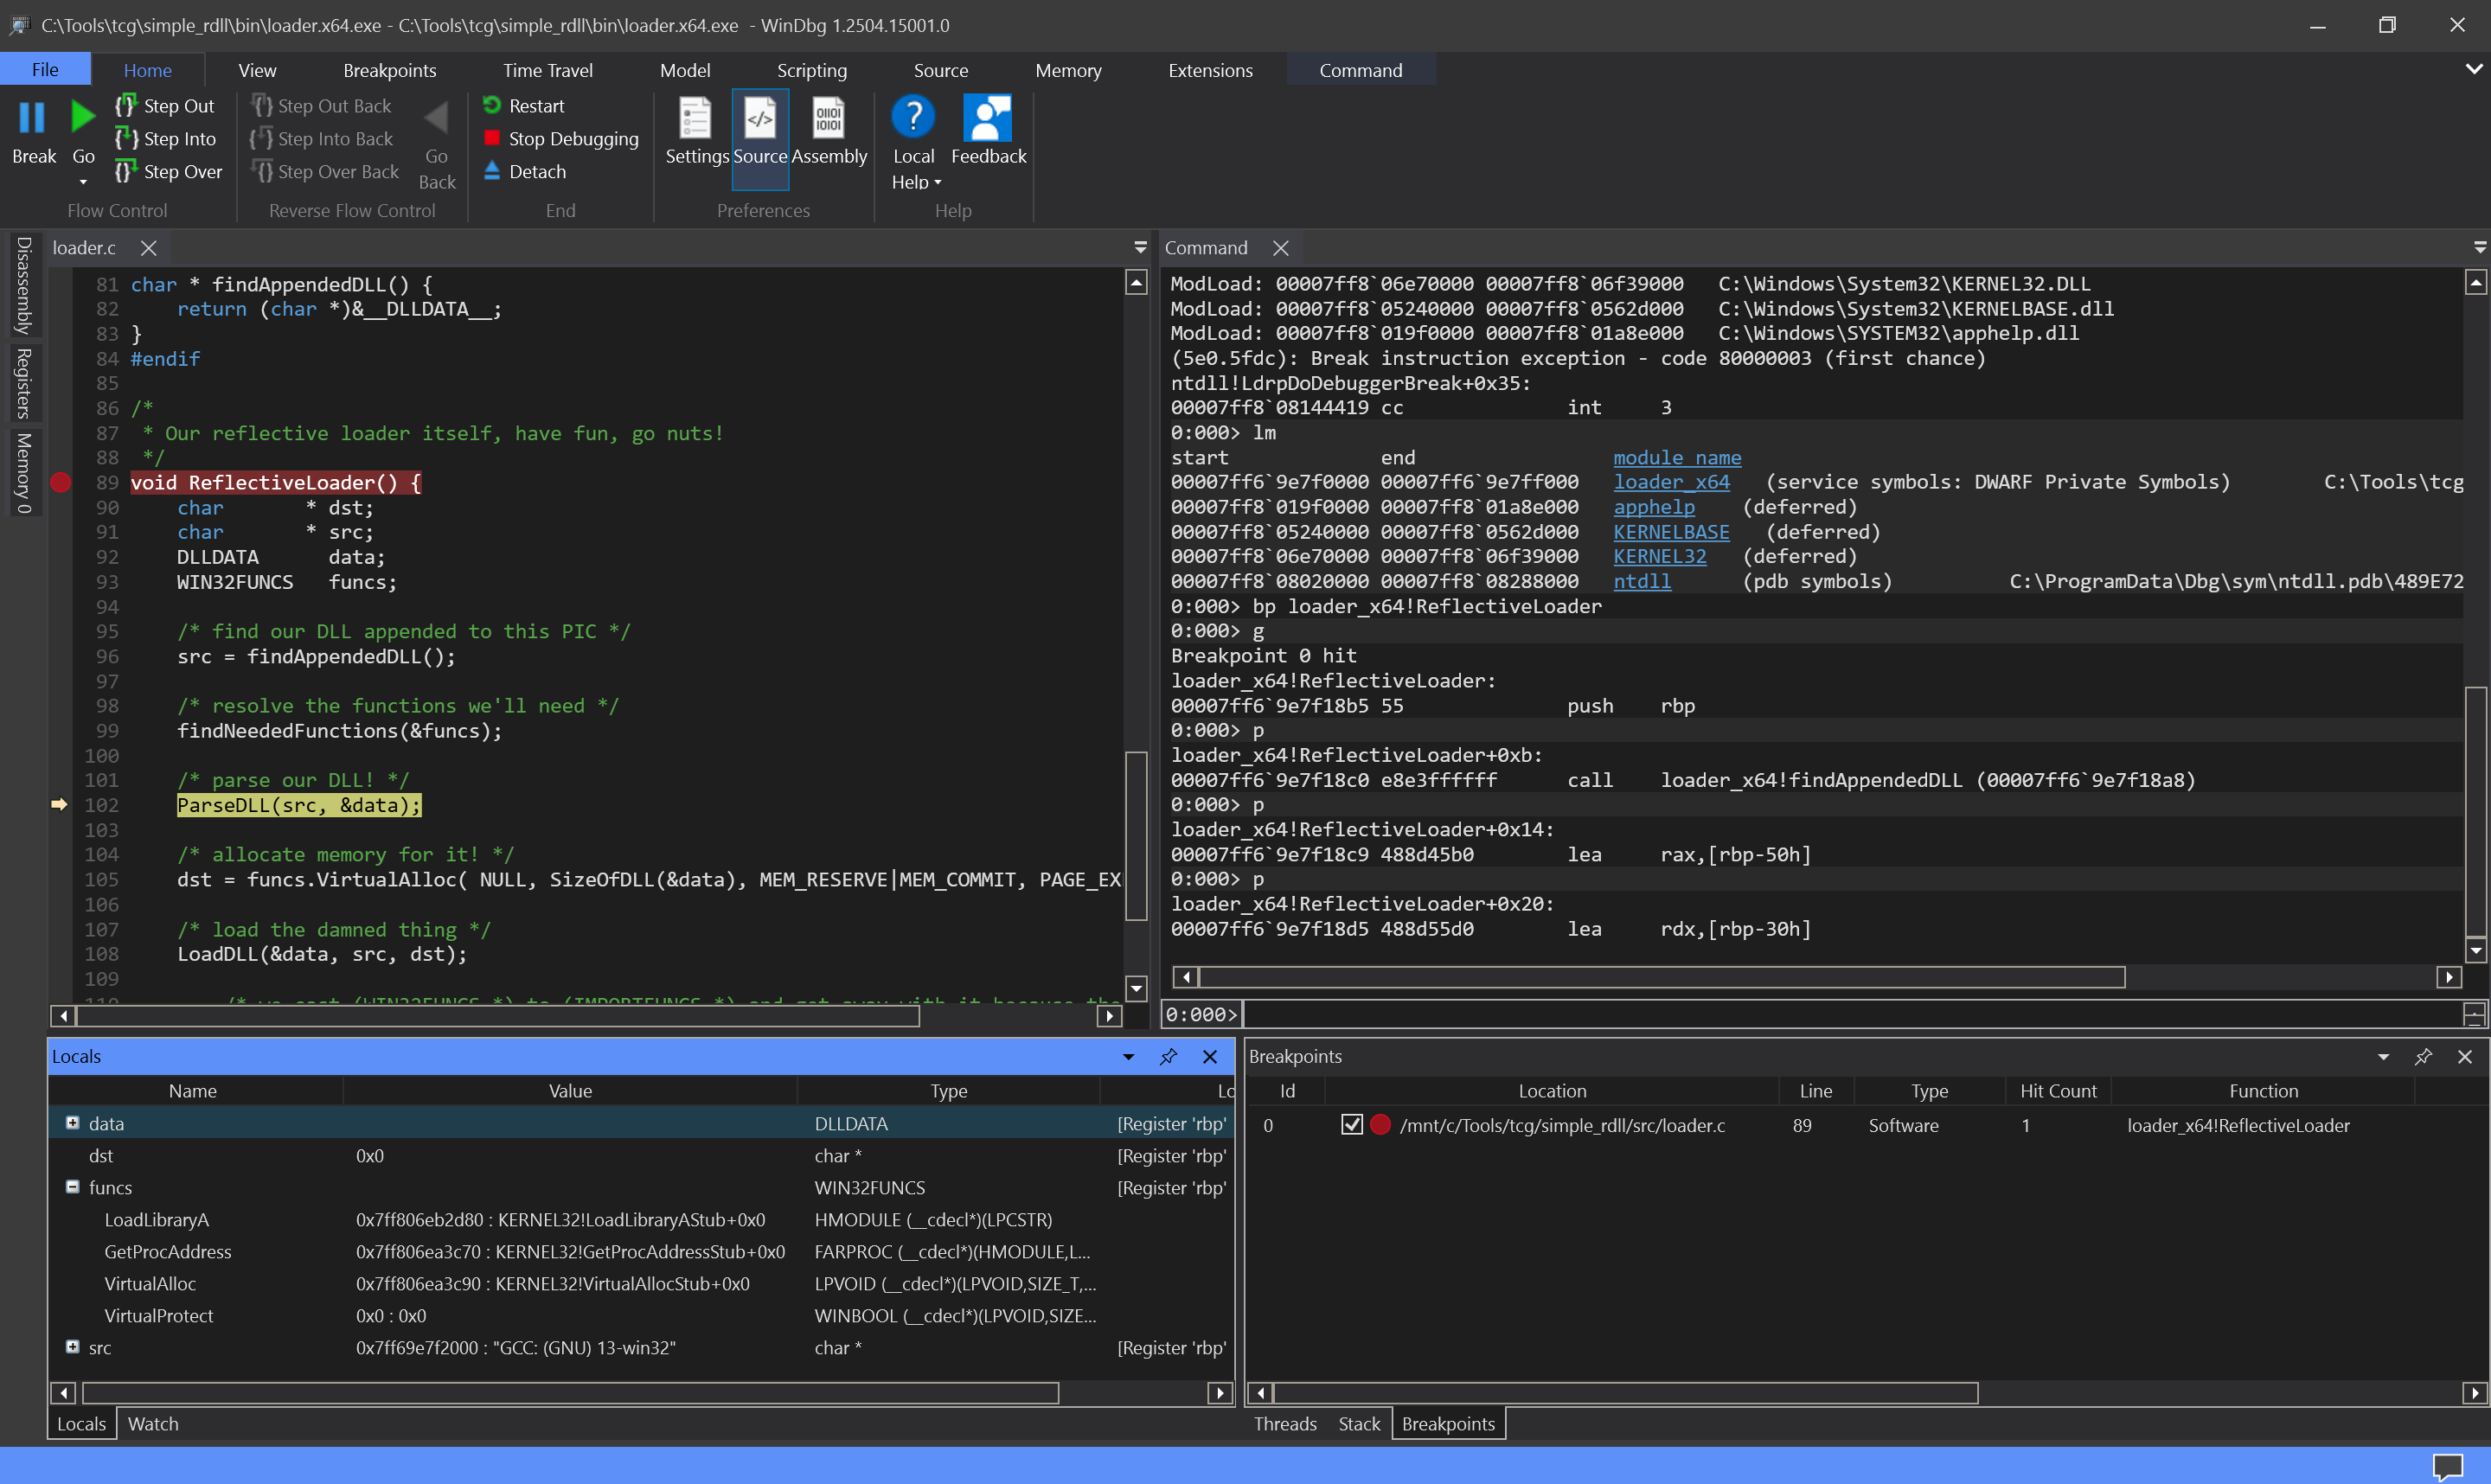
-rwxrwxrwx 1 daniel daniel 20410 Jul 24 22:03 loader.x64.oThen in WinDbg's settings, add the path to the loader's source code under debugging paths.
And then after launching the loader executable, you can place breakpoints, etc, and away you go.
The astute will notice that we don't actually have an appended DLL to load, because that would normally get linked in by Crystal Palace. That's ok - we can grab test.x64.dll from the CP distribution and use xxd to dump it to a C include-style array.
$ xxd -i test.x64.dll

unsigned char debug_dll[] = {
  0x4d, 0x5a, 0x90, 0x00, 0x03, 0x00, 0x00, 0x00, 0x04, 0x00, 0x00, 0x00,
  ...
};
Create a new header file, debug.x64.h, with this content and use a DEBUG preprocessor directive to build it in as needed.
#ifdef DEBUG
#ifdef WIN_X64
#include "debug.x64.h"
#else
#include "debug.x86.h"
#endif
#endif

...

char * findAppendedDLL() {
#ifdef DEBUG
	return (char*)debug_dll;
#else
	return (char *)&__DLLDATA__;
#endif
}
loader.c
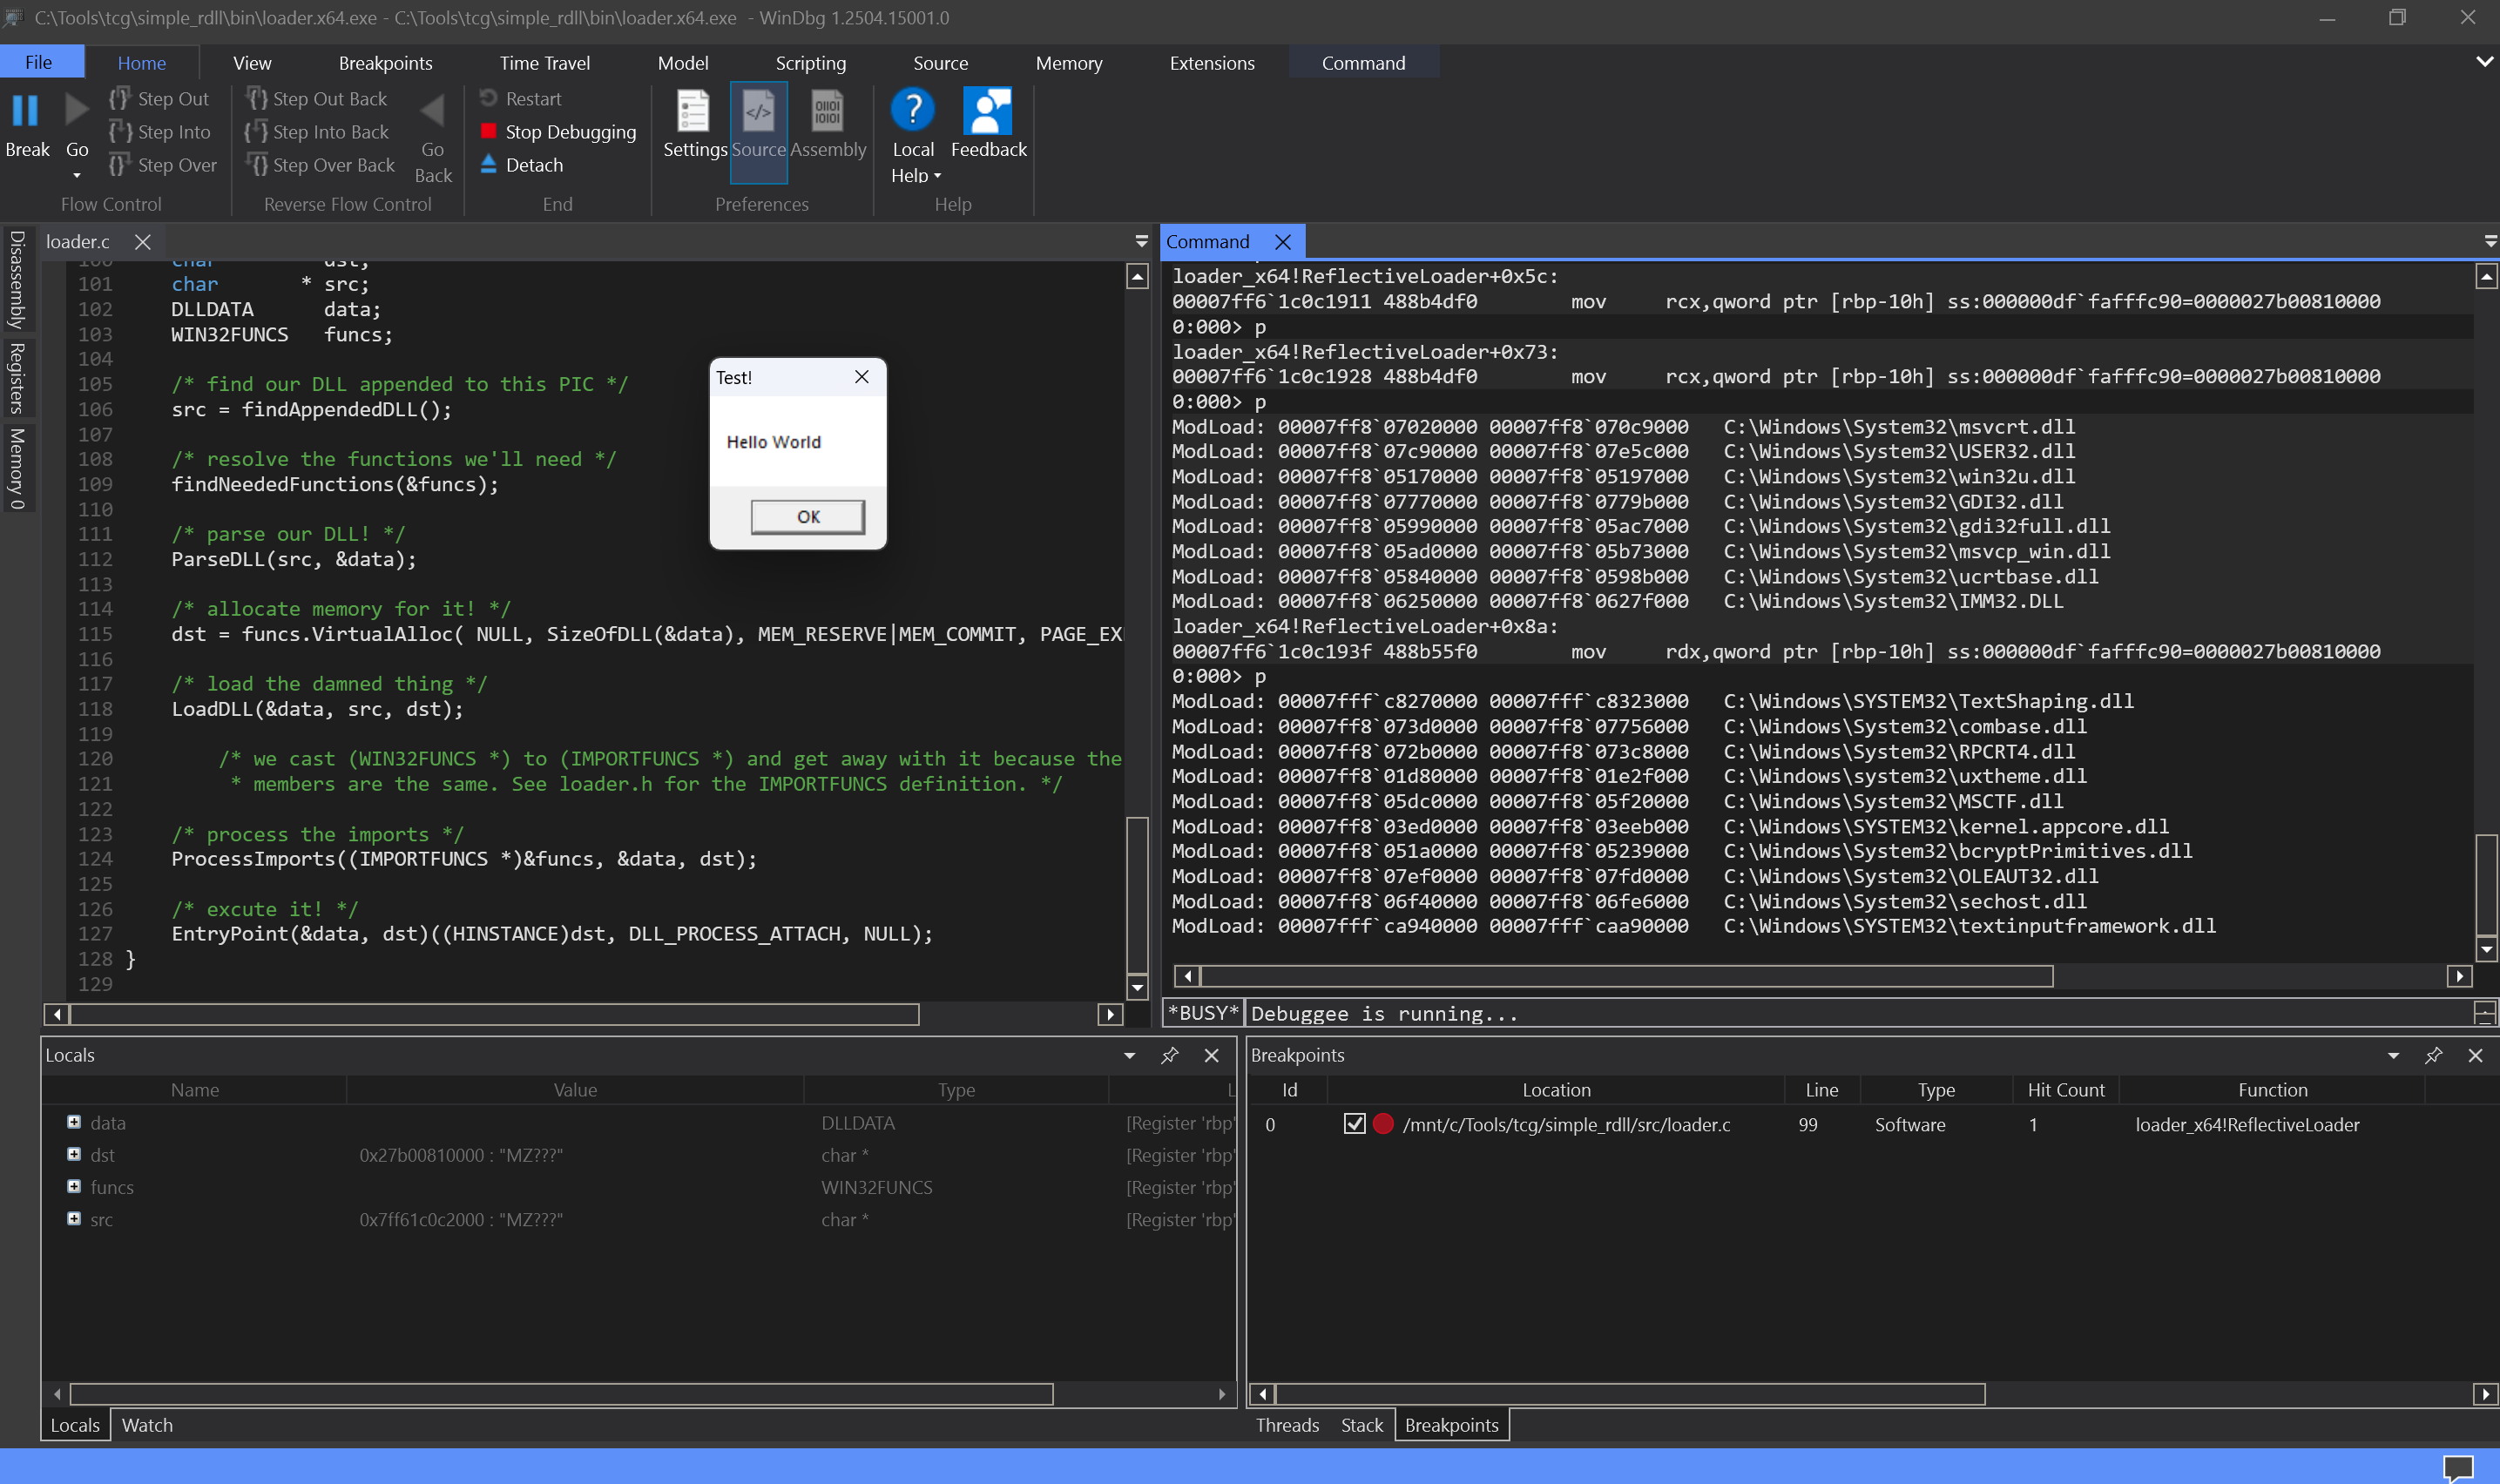
-DDEBUG to the Makefile for the debug builds.After building the executable again, we can debug it end-to-end.
Debugging COFFs
I didn't have much hope of being able to debug COFFs like this, owing to the MODULE$Function (DFR) convention for linking to Win32 APIs. This is a custom convention that Raffi originally used in Cobalt Strike's BOFs, and now here again in Crystal Palace.
#include <windows.h>

WINBASEAPI VOID WINAPI USER32$MessageBoxW(HWND hWnd, LPCWSTR lpText, LPCWSTR lpCaption, UINT uType);

void go() {
    USER32$MessageBoxW(NULL, L"Hello World", L"PICO", MB_OK);
}
test.c
Standard linkers cannot handle this, so the build just throws an error.
/usr/bin/x86_64-w64-mingw32-ld: bin/test.x64.o: in function `go':
/mnt/c/Tools/tcg/simple_rdll/src/test.c:6:(.text+0x27): undefined reference to `__imp_USER32$MessageBoxW'
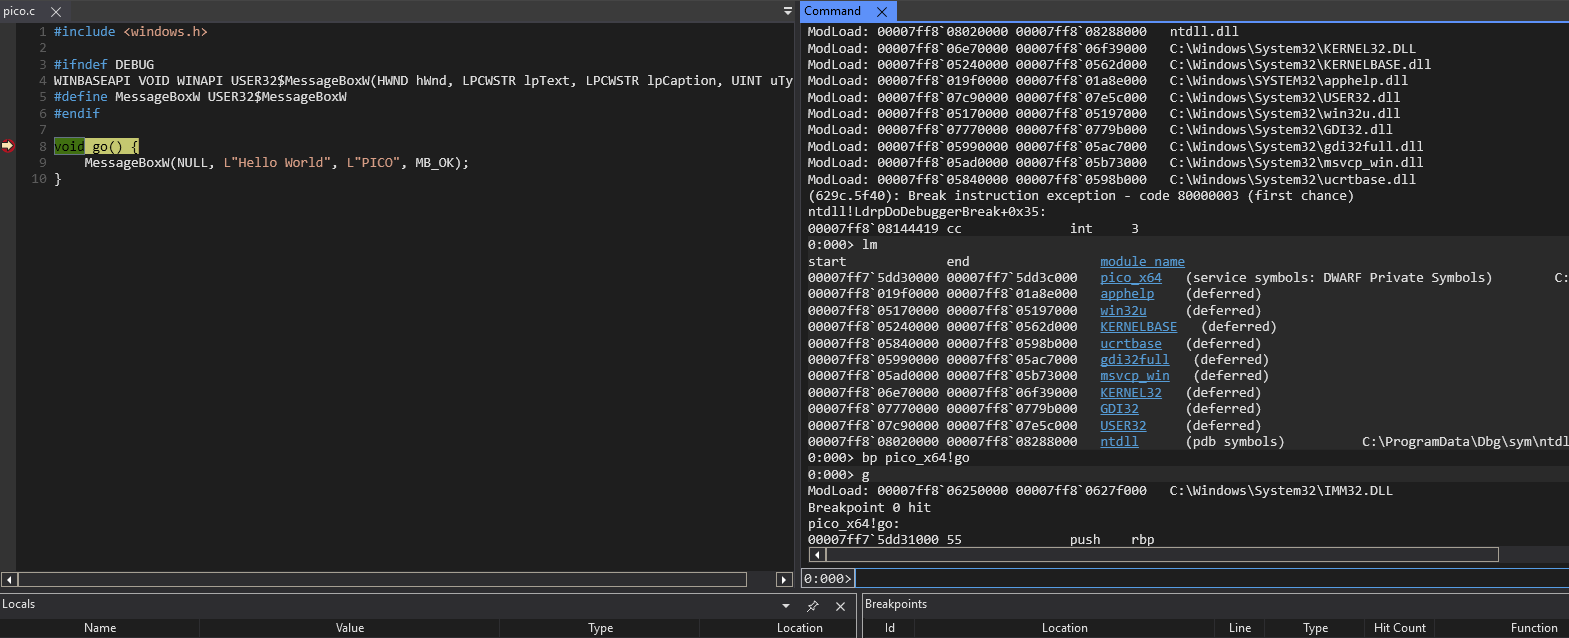
collect2: error: ld returned 1 exit statusThe simplest way I could think of to deal with this is by using a preprocessor directive to only define the DFR when not in debug. When in debug, the linker will identify MessageBoxW and link to the legitimate function in user32 instead.
#include <windows.h>

#ifndef DEBUG
WINBASEAPI VOID WINAPI USER32$MessageBoxW(HWND hWnd, LPCWSTR lpText, LPCWSTR lpCaption, UINT uType);
#define MessageBoxW USER32$MessageBoxW
#endif

void go() {
    MessageBoxW(NULL, L"Hello World", L"PICO", MB_OK);
}
test.c
This is obviously quite ugly, so a more ergonomic solution may be to come up with a DFR macro like the Cobalt Strike BOF template has. Either way, linking the COFF to an executable in the same way above does allow WinDbg to debug it.
Debugging PICOs?
I find myself dropping into a habit of using the terms COFF and PICO interchangeably, but this isn't accurate. A COFF is the artefact produced by the compiler and a PICO is what Crystal Palace produces from a COFF. That means you cannot take a COFF and attempt to run it in a loader (via PicoLoad/PicoEntryPoint).
A PICO is produced via a spec file, where you'd do something like:
x64:
  load "bin/loader.x64.o"
    make pic

  load "bin/test.x64.o"
    make object
	export
	link "test_pico"

export
You can technically write a spec file that will produce a PICO from a COFF, without linking it to a loader:
x64:
  load "bin/test.x64.o"
	make object

export
$ ./piclink ../path/to/loader.spec x64 test.x64.binHowever, this doesn't work with 'debug' COFFs because Crystal Palace won't be able to deal with Win32 APIs.
[-] Function MessageBoxW is not imported and not in MODULE$function format in loader.spec (x64)You can only build a 'release' COFF and turn it into a PICO, but this won't have the benefit of debugging information.
$ xxd test.x64.bin
00000000: 0010 0000 3800 0000 6f00 0000 0000 0000  ....8...o.......
00000010: 0205 1000 0000 0000 0000 0000 4000 0000  ............@...
00000020: 0206 1000 4000 0000 0000 0000 3800 0000  ....@.......8...
00000030: 0500 0800 1100 0000 0500 0800 1800 0000  ................
00000040: 0500 0800 2700 0000 0300 0b00 5553 4552  ....'.......USER
00000050: 3332 0004 0010 004d 6573 7361 6765 426f  32.....MessageBo
00000060: 7857 0006 0008 0000 0000 0000 0004 0055  xW.............U
00000070: 4889 e548 83ec 2041 b900 0000 004c 8d05  H..H.. A.....L..
00000080: f3ff ffff 488d 05f6 ffff ff48 89c2 b900  ....H......H....
00000090: 0000 0048 8b05 d5ff ffff ffd0 9048 83c4  ...H.........H..
000000a0: 205d c390 9090 9090 9090 9090 9090 9000   ]..............
000000b0: 0000 0000 0000 0050 0049 0043 004f 0000  .......P.I.C.O..
000000c0: 0048 0065 006c 006c 006f 0020 0057 006f  .H.e.l.l.o. .W.o
000000d0: 0072 006c 0064 0000 0000 0000 0000 0000  .r.l.d..........
000000e0: 0000 0000 0000 00                        .......
You can throw this output into a debug header file and use it as above. WinDbg will allow you to step through the assembly instructions of the PICO when calling PicoEntryPoint, but it won't give you the source code in parallel.
Conclusion
I have shown one approach to improving QoL for developing Crystal Palace loaders using the vscode WSL extension; and for producing debug builds of loaders and COFFs that work with WinDbg. I honestly think that these small, simple changes are enough to encourage more people to work with the TCG projects; particularly if you're like me and just prefer a vscode environment over nano.